Parse Logs Like an Admin: grep, awk, and sed on Real Shapes
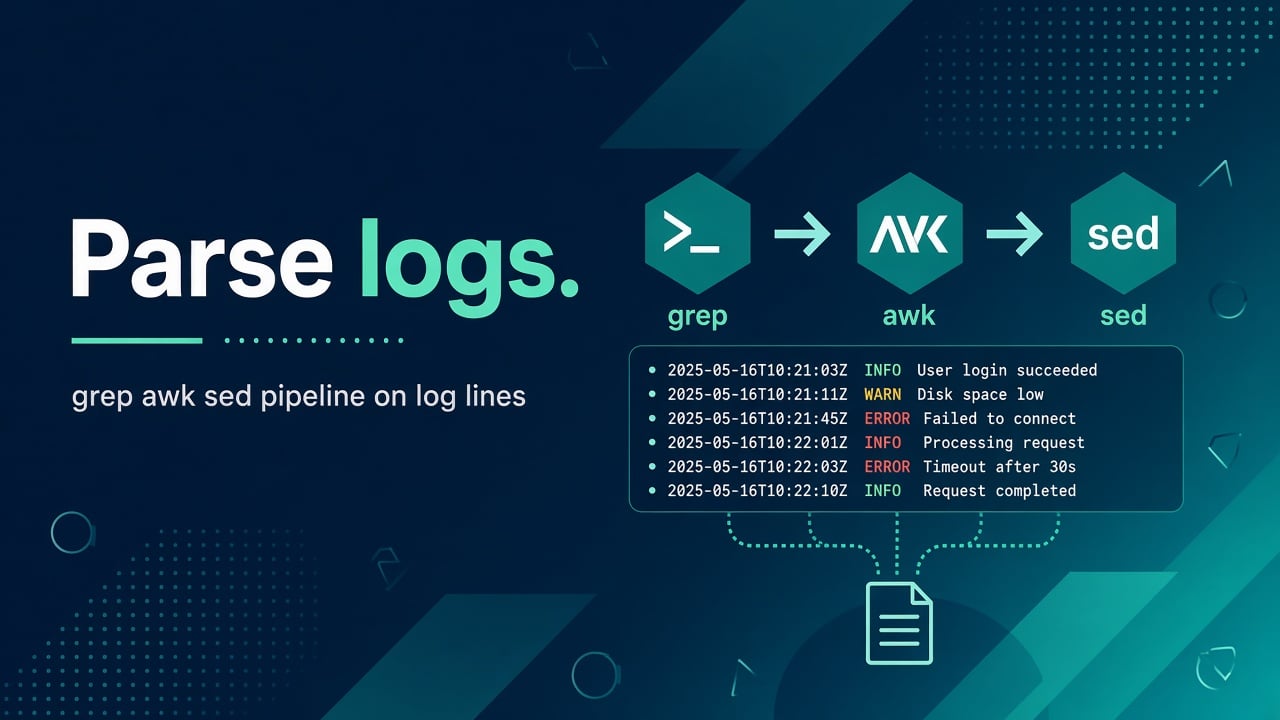
During an incident you rarely have a log platform to lean on. You have an SSH session, a few gigabytes of text, and someone asking what is going on. The skill that matters is not memorising every flag of grep, awk and sed. It is looking at the shape of the log first, then picking the smallest tool that answers your question.
Here is what I would actually run mid-incident on a web server: find the errors, count what is failing, cut the log to the incident window, then check the systemd journal and SSH logs. Every command is explained so you can adapt it instead of pasting it.
Look at the shape before you write a pipeline
Run tail -n 5 on the file and read what you see. Is it space-separated like an nginx access log, key=value pairs, JSON per line, or the systemd journal? That answer picks the tool: grep for “does this line matter”, awk for “give me column 9”, sed for “rewrite this piece”, and jq for JSON. Writing a clever pipeline against a format you have not looked at is how you get confident, wrong numbers.
If your own scripts write the logs, make them easy to search later. The conventions in Bash logging and error handling (ISO timestamps, levels, one event per line) are what make everything below work.
grep: find the lines that matter
grep -E 'error|ERROR|CRIT' /var/log/nginx/error.log | tail -n 50
grep -R --line-number --binary-files=without-match 'OutOfMemory' /var/log/myapp/ | head
zgrep -H 'timeout' /var/log/nginx/access.log.*.gz | tail-Eturns on extended regular expressions, so|means “or” without escaping.tail -n 50keeps only the newest 50 matches, because in an incident the recent lines matter most.-Rsearches directories recursively,--line-numbershows where each match is, and--binary-files=without-matchskips binary files so you do not get garbage in your terminal.zgrepsearches inside rotated.gzfiles without unpacking them, and-Hprints the filename so you know which day a hit came from.
You do not need cat file | grep. grep reads files itself, and skipping the extra process matters on large logs. For context around a hit, add -C 3 to see three lines before and after.
awk: count and summarise by field
# Which URLs are returning 5xx?
awk '$9 ~ /^5/ {print $9, $7}' /var/log/nginx/access.log | sort | uniq -c | sort -nr | head

# How many requests per status code?
awk '{c[$9]++} END {for (k in c) print c[k], k}' /var/log/nginx/access.log | sort -nr
In nginx’s default combined format, field 9 is the HTTP status and field 7 is the requested path. $9 ~ /^5/ means “field 9 starts with 5”. The first command prints status and URL for every 5xx, then sort | uniq -c | sort -nr counts identical lines and puts the most frequent first. That trio is the workhorse of log triage: sort so duplicates are adjacent, count them, sort by count.
The second command builds a counter array c keyed by status code, then prints the totals in the END block. It is a quick way to see whether errors are 2% or 40% of traffic.
Field numbers shift if the log format is custom or a user-agent contains odd spacing. Before trusting a result, spot-check with head -n 3 and awk '{print NF}' to see whether every line has the same number of fields.
sed: small, targeted rewrites
sed -n 's/.*user=\([^ ]*\).*/\1/p' app.log | sort | uniq -cThis extracts the value after user= from each line. -n switches off automatic printing, the s/.../.../ replaces the whole line with just the captured group \1, and the trailing p prints only lines where a substitution happened. Then the usual sort | uniq -c counts users. Use sed for simple substitutions and line filtering. Once you find yourself writing a long sed expression, switch to awk, or to jq if the logs are JSON:
jq -r 'select(.level == "error") | .msg' app.json.log | sort | uniq -c | sort -nr | headSlicing an incident window
Cut the log to the incident window before you count anything, or yesterday’s noisy hour ends up in your numbers. For nginx logs, timestamps look like [22/Sep/2026:10:15:32 and compare correctly as strings within a single day:
awk '$4 >= "[22/Sep/2026:10:00" && $4 < "[22/Sep/2026:10:31"' /var/log/nginx/access.logThe end bound is 10:31 with a strict < so that every line from 10:30:00 to 10:30:59 is included. A <= comparison against 10:30 would silently drop that last minute.
String comparison stops working across month boundaries because “Sep” and “Oct” do not sort chronologically. For anything longer than a day, use journalctl --since and --until, or convert timestamps first.
journalctl as a log source
journalctl -u nginx --since '1 hour ago' -o short-iso | grep -i error
journalctl -p err -b --no-pager | head -n 100
-u nginx limits output to one unit, --since sets the window, and -o short-iso prints ISO timestamps that are easy to sort and paste into tickets. In the second command, -p err shows priority “error” and worse, -b limits to the current boot, and --no-pager stops journalctl opening less so the output can be piped. If a service will not start, go to systemd service failed to start. If journals themselves are eating the disk, see Linux disk full.
SSH failures: counting the noise
grep 'Failed password' /var/log/auth.log | awk '{print $(NF-3)}' | sort | uniq -c | sort -nr | headA failed-login line ends with from 203.0.113.9 port 51234 ssh2, so the IP address is the fourth field from the end. $(NF-3) means “field number (number of fields minus 3)”, which works even though the earlier part of the line varies in length. The result is a ranked list of source addresses.
Two portability notes. On RHEL, Rocky and Alma the file is /var/log/secure, not auth.log. On systems that log only to the journal, use journalctl -u ssh (the unit is ssh on Debian and Ubuntu, sshd on RHEL family). Use this to understand what is hitting the server, then act on it with the SSH hardening checklist or by comparing fail2ban and security groups.
When to turn a pipeline into a script
If you run the same pipeline three times, save it. Wrap it with strict mode and logging as described in Bash scripting for sysadmins, and if it should run daily, schedule it with the wrapper pattern from scheduling and wrapping cron jobs.
Practice drills
- Generate a fake access log of a few thousand lines with random status codes and find the top five URLs returning 5xx.
- Create a systemd unit that fails on purpose and read its failure in the journal.
- Write a script that saves a daily error summary to a file.
- Feed your parser a malformed line and make it survive.
Common questions
What is the difference between grep -i and grep -E?
-i ignores case. -E enables extended regular expressions. They are independent, and you can combine them, but add flags only when you know why you need each one.
When should I use jq instead?
Any time each line is JSON. Regexes on JSON break the moment a field order or escaping changes. If jq is missing, install it, or make the application emit plain key=value lines.
Can this replace a log platform?
No. This is fast triage on one machine. A central platform gives you search across hosts, retention and alerting. Use both: the shell for the first five minutes, the platform for everything after.
Sources
- GNU grep manual
- GNU awk user’s guide
- nginx log module, for the combined log format
- journalctl manual
- jq manual