GDB Cheat Sheet for Sysadmins: Backtraces, Breakpoints and Core Files
Most administrators meet gdb, the GNU Debugger, on a bad day: a service dies with Segmentation fault, a process hangs and nobody knows where, or a developer asks for a “backtrace” and a core file. You do not need to be a C programmer to get something useful out of it. A handful of commands will tell you which function crashed, what the program was waiting for, and what the variables held at that moment. This cheat sheet collects them and shows each one on a small test program, so you know what the output looks like before you need it.
The examples ran on Ubuntu 24.04 with GDB 15.1, inside a throwaway Docker container so nothing was installed on the host. The programs are tiny C files compiled for the demonstration; the commands are the same ones you would use on a real crashed service.
Setting up
Install the debugger with your package manager (sudo apt install gdb on Debian and Ubuntu, sudo dnf install gdb on Red Hat family systems). The most useful backtraces come from programs that carry debug symbols, which give function names, file names and line numbers. If you compile the code yourself, add -g (and -O0 while debugging, because optimisation reorders code and hides variables):
gcc -g -O0 -o demo demo.cFor programs from a distribution package, symbols are usually in a separate package, or fetched on demand: modern GDB can use a debuginfod server, and Ubuntu runs one at debuginfod.ubuntu.com. Without debug symbols you still get whatever function names the symbol tables contain, but not line numbers or local variables.
The commands worth memorising
| Command | What it does |
|---|---|
run (or r) |
Start the program; run arg1 arg2 passes arguments |
bt / backtrace |
Show the chain of function calls that led here; bt full adds local variables |
frame N, up, down |
Move between stack frames |
break func or break file.c:20 |
Stop when execution reaches a function or line |
info breakpoints, delete N |
List and remove breakpoints |
continue (c) |
Resume until the next stop |
next (n), step (s) |
Run one line, stepping over (next) or into (step) function calls |
finish |
Run until the current function returns and show its return value |
print expr (p) |
Show a variable or expression; p *ptr, p arr[2]@3 for three elements |
info args, info locals |
Show the current function’s arguments and local variables |
watch var |
Stop whenever a variable changes |
x/s ptr, x/8xb ptr |
Examine memory as a string, or as eight bytes in hex |
info threads, thread apply all bt |
List threads; print a backtrace for every thread |
gdb -p PID or attach PID |
Attach to a running process (the first is typed in the shell, the second inside GDB) |
gcore or gcore file |
Inside GDB, write a core file of the attached process |
quit (q) |
Leave GDB (detaching if attached) |
The GDB commands above can also be passed on the shell command line with -ex, and -batch makes GDB run them and exit. That is how the examples below were captured, and it is convenient for scripts and for pasting into a bug report.
Run it and read the crash
The test program calls a function with a NULL pointer. Run it under GDB with run, then ask for a backtrace with bt:
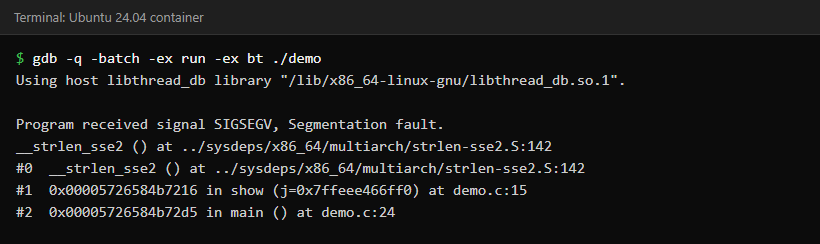
Read the backtrace from the bottom up. main called show at demo.c line 24, and show called strlen at line 15, where the crash happened. Frame 0 is the innermost frame, where execution stopped; here that is inside strlen, so frame 1, the call from the program’s own code, is the one to look at. The program’s own output (sum=108 and the first job line) is also missing. Its standard output was a pipe, so it was buffered and had not been flushed when GDB stopped, and a real crash would normally lose it. In an interactive terminal the output is line-buffered and you would see it.
Now look at that frame. frame 1 selects it, and print shows the data:
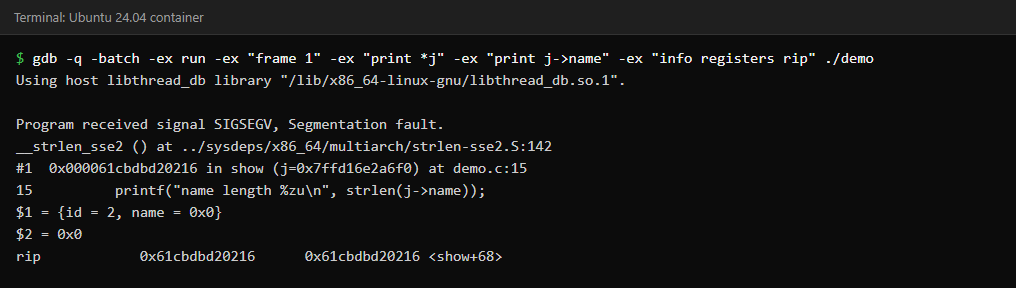
That identifies the immediate cause: strlen was handed a NULL pointer because the second job’s name is NULL. It does not say how it became NULL; that is the next question for whoever owns the code, and a backtrace like this is what they will ask you for.
Stop at a function and look around
break total stops when execution enters that function. From there, info args shows what it was called with, next moves one line at a time, info locals shows its variables, and finish runs until the function returns and prints the value it returned:
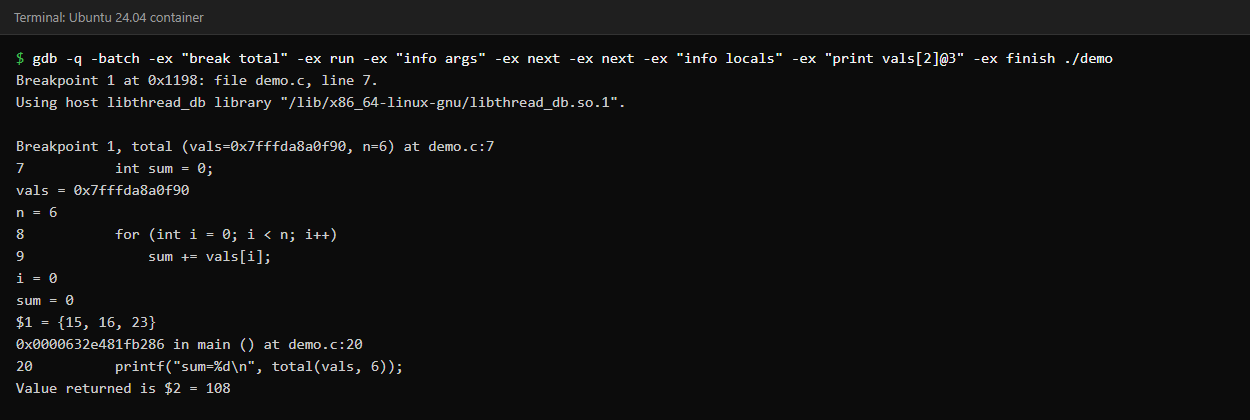
print vals[2]@3 is the trick for arrays: it prints three elements starting at index 2. For a string, x/s or plain print works. Use set var name = value to change a variable while the program is stopped, which is handy for testing a theory without recompiling.
Watch a variable change
A watchpoint stops the program when the watched value changes, and tells you the old and new values and where the change happened. It is the way to answer “what is changing this?”:
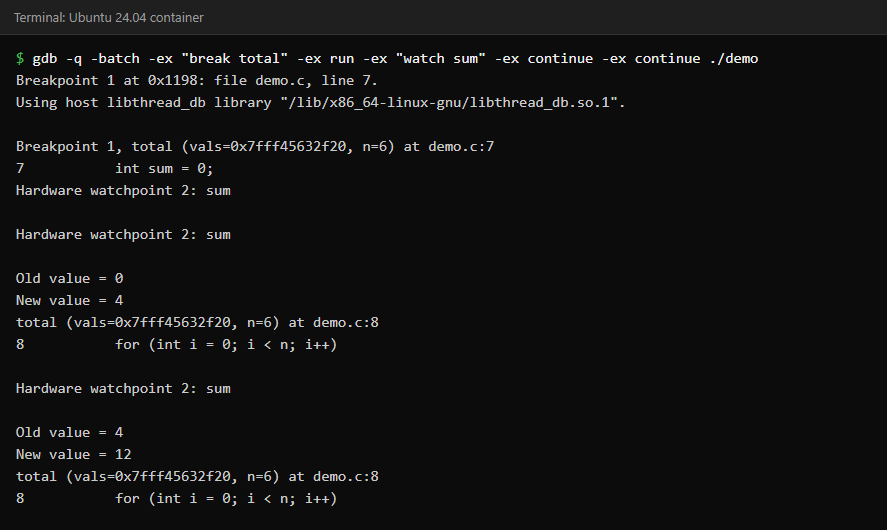
GDB used a hardware watchpoint here, which is fast. The CPU supports only a few of them at a time, and GDB falls back to much slower software watchpoints when it runs out. A watch on a local variable goes away when its function returns, so set it while you are inside that function.
Attach to a hung or running process
For a process that is stuck, you do not need to restart it. Attach, print every thread’s stack, and let go:
sudo gdb -p PID -batch -ex "thread apply all bt"Ubuntu and some other distributions restrict attaching to existing processes (kernel.yama.ptrace_scope). With the default setting, attaching generally needs an allowed relationship between debugger and target, or the CAP_SYS_PTRACE capability, which sudo normally provides. In a container, attaching may need --cap-add=SYS_PTRACE, depending on the security settings, which is why the test below was run that way. The test program has two threads, both sleeping:
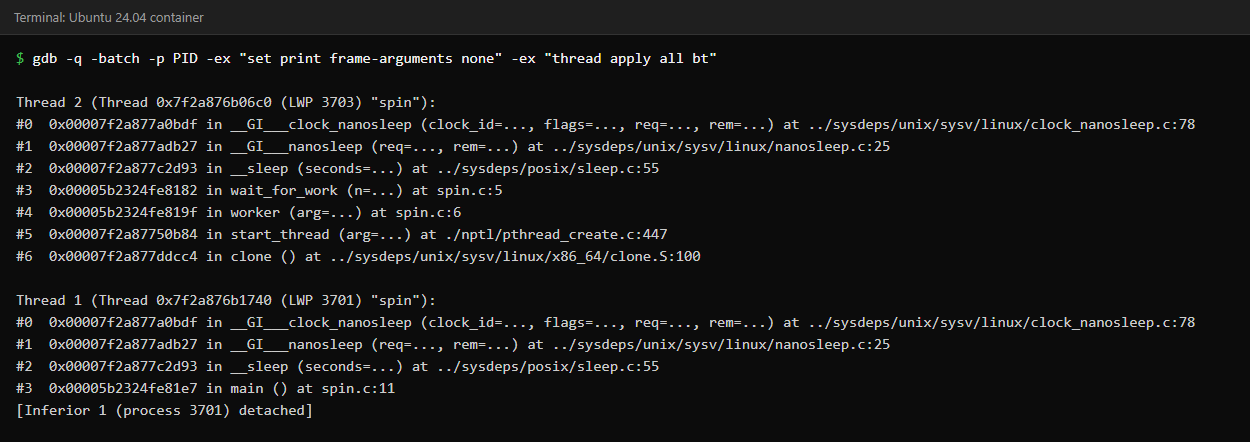
This helps separate the two common kinds of “hang”. If each thread is waiting in something like sleep, poll, futex_wait or read, the process is probably blocked on something else, perhaps a lock, a socket or a dead dependency. If one thread is in your own code and the CPU is pegged, it is probably spinning. One snapshot is only a clue, though: sleeping threads can be perfectly healthy, so take two or three snapshots a few seconds apart and compare them with per-thread CPU use (top -H -p PID). A caution for production: attaching stops the process, and it stays stopped until GDB resumes or detaches it. Keep the session short and prefer -batch, which detaches when the commands finish.
Save a core file
A core file is a snapshot of a process’s state and selected memory. You can take one from a live process with gcore (the gcore PID helper that ships with GDB, or sudo gdb -p PID -batch -ex gcore, which detaches when done), or let the kernel write one when a process crashes. Open it later, with the same binary and matching libraries, without the process running:
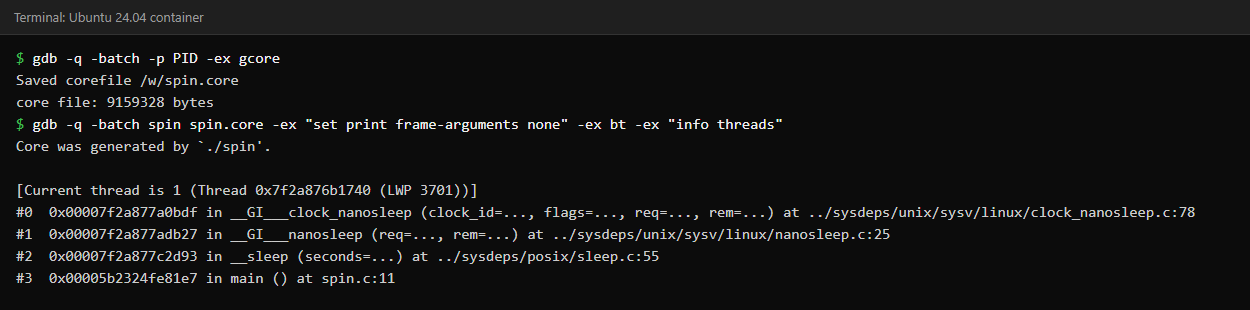
Whether a crash produces a core file depends on the system. For dumps written straight to a file, the crashing process needs a core size limit above zero (ulimit -c showed unlimited in the shell inside the container used here, but a service started by systemd or a container runtime has its own limits), and /proc/sys/kernel/core_pattern decides where the file goes or which handler receives it. On systems that capture dumps with systemd-coredump, coredumpctl list shows captured crashes, and coredumpctl gdb opens the latest one in GDB. Ubuntu may route cores through its crash reporter instead, so look there before concluding that nothing was saved. Core files contain whatever was in memory, including passwords and keys, so treat them as sensitive and delete them when the investigation is over.
Common questions
Can I use GDB on a program without debug symbols?
Yes, but the output is thinner: function names for exported symbols, no line numbers, and usually no local variables. Install the matching debug-symbol package or use a debuginfod server to improve it.
Does attaching GDB stop the process?
Yes. Attaching stops the process, and it stays stopped until you continue or detach. On a busy production service that can be long enough to fail a health check, so do it deliberately.
What is the difference between next and step?
next runs a line, treating a function call as one step. step goes into the function being called; if that function has no debug information, GDB runs through it without stopping.
How do I debug with arguments?
Either run arg1 arg2 inside GDB, or start it as gdb --args ./program arg1 arg2.
Keep reading
- systemd: Unit Failed to Start — How to Read journalctl and Fix It — Start here when a service will not come up.
- Linux OOM Killer: Why Your Process Died and How to Stop the Next One — Another reason processes die without warning.
- Load Average High but CPU Idle? What Linux Is Trying to Tell You — Find out what a busy or stuck process is doing.