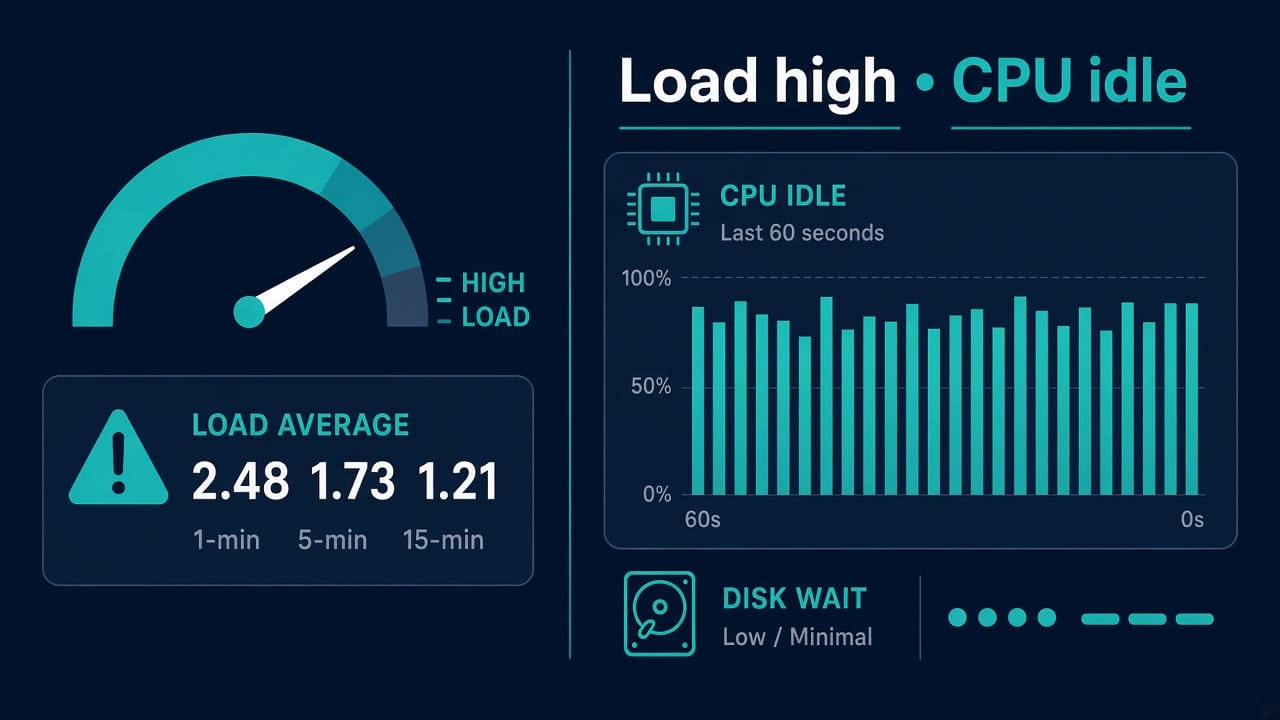
Load Average High but CPU Idle? What Linux Is Trying to Tell You
Monitoring screams: load average 47. You open top and the CPUs look bored. Someone suggests buying a bigger instance. Someone else suggests rebooting. You pour chai and remember: on Linux, load average is not “CPU %”.
Load average counts runnable threads plus threads in uninterruptible sleep (usually disk/NFS). High load + idle CPUs often means you’re stuck on I/O, not compute. That’s good news — different fix.
Performance work pairs well with solid fundamentals from the Linux beginner roadmap and the operational habits in the DevOps transition guide.
What load average actually measures
The three numbers (1.00 5.00 15.00 style) are exponentially damped averages of the run queue length over 1, 5, and 15 minutes.
- Includes tasks waiting for CPU (R state)
- Includes tasks in uninterruptible wait (D state) — classic disk
- Does not equal utilization percentage by itself
Rule of thumb: compare load to CPU count. Load 8 on 8 cores of pure CPU work is busy; load 8 on 8 cores with 90% idle and high iowait is a storage story.
nproc
lscpu | grep '^CPU(s)'
uptime
The 3-minute triage toolkit
uptime
top -o %CPU
# or htop if installed
vmstat 1 10
iostat -xz 1 5    # sysstat package
free -h
ps -eo state,pid,ppid,cmd | awk '$1=="D" {print}'

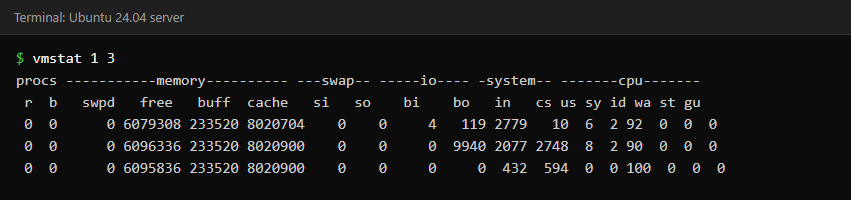
What you’re looking for:
- vmstat procs r / b — runnable vs blocked
- cpu wa — iowait
- D state processes — stuck on I/O
- memory pressure — swapping can inflate weirdness (si/so in vmstat)
Story A — CPU bound (matches intuition)
High load, high %CPU, low iowait. Find hot processes, profile the app, scale horizontally, fix a busy loop, check for crypto miners (yes, still).
Also verify you didn’t accidentally start N copies of the same worker — related to the same discipline as port already in use conflicts after partial deploys.
Story B — Disk / uninterruptible wait (the idle CPU paradox)
High load, low %CPU, elevated iowait, D-state tasks. Causes:
- Dying or saturated disks
- Raid rebuilds
- log storms writing synchronously
- databases doing huge scans on cold storage
- NFS servers not responding (famous for D-state piles)
iostat -xz 1
sudo iotop -o
lsblk
dmesg -T | tail -n 50
If the root filesystem filled up mid-write, you can get cascading stalls — check disk full triage.
Story C — NFS and network filesystems
When NFS goes sideways, load can skyrocket while CPUs nap. Check mounts:
mount | grep nfs
nfsstat -c
Soft vs hard mounts change failure behavior. Hard mounts without timeouts can leave processes in D forever. This is infrastructure design, not a one-line fix.
Story D — thrashing / memory
If the box is swapping hard, everything waits. Load rises, interactivity dies.
free -h
vmstat 1 5
Fix memory leaks, right-size cgroup limits for containers, add RAM only after you know what’s eating it.
Containers and cgroups: load on host vs inside
Host load average is global. A noisy neighbor container can make the host load look scary while your container’s CPU quota is fine — or the opposite. Check:
docker stats
# or kubectl top / cgroup cpu.stat depending on stack
Don’t scale the wrong layer.
Read top without lying to yourself
- Sort by CPU, then by memory
- Watch the
wafigure in the summary header - Note steal (
st) on VMs — hypervisor contention - Load averages alone don’t tell you which story; always pair with vmstat/iostat
What to do operationally
- Classify: CPU vs I/O vs memory vs NFS vs steal.
- If I/O: identify filesystem and process; shed load (read-only mode, rate-limit jobs, stop runaway reports).
- If NFS: fix/fence the NFS server path; don’t reboot app nodes in a loop hoping for magic.
- If CPU: kill/fix the offender; capacity plan with data.
- Write the postmortem with graphs — load alone in a ticket helps nobody.
While you’re in incident mode over SSH, remember not to compound outages with unsafe commands — commands that can wipe a server — and keep access paths solid via the SSH hardening checklist.
Worked example: load 60, CPUs idle, NFS D-state army
ps shows dozens of processes in D; mount shows NFS to a storage appliance. The appliance’s network path degraded. App nodes aren’t “slow CPUs” — they’re waiting.
Response:
- Stop starting more NFS-heavy batch jobs.
- Engage storage/network owners with proof (
nfsstat, load graphs, D-state samples). - Avoid hard reboots that leave filesystems dirty unless fencing requires it.
- After recovery, review mount options and monitoring for NFS latency.
More signals and context
Extra tools and angles for load investigations.
Interpreting vmstat quickly
procs -----------memory---------- ---swap-- -----io---- -system-- ------cpu-----
 r  b   swpd   free   buff  cache   si   so    bi    bo   in   cs us sy id wa st
- High
r, lowwa→ CPU contention - High
b, highwa→ I/O wait - Nonzero
si/sosustained → swapping pain - High
st→ stolen by hypervisor
Application-level contributors
Thread pools that stampede, GC pauses causing backlog, connection pools waiting on a stuck DB — all can raise load. Pair OS metrics with app latency (p95/p99). The kernel view without the app view starts religious wars in incident channels.
Capacity planning without mythology
Track saturation (CPU, disk queue, network) not only utilization. A disk at 40% bytes full can still be IO-saturated. Load average is one signal in a dashboard, not a personality test for your server.
When reboot “fixes” high load
It clears stuck processes and memory pressure — and destroys forensic evidence. Prefer targeted service restarts after classification. If you must reboot, capture vmstat, ps, and iostat output first.
PSI (Pressure Stall Information) — modern signal
On newer kernels, pressure metrics in /proc/pressure/ (cpu, io, memory) tell you who is stalling. Some monitoring stacks expose PSI natively. If load is confusing, PSI can clarify whether it’s CPU, IO, or memory pressure.
cat /proc/pressure/cpu
cat /proc/pressure/io
cat /proc/pressure/memory
Database hosts and load theater
A primary database can show modest CPU and scary load when storage latency spikes. Always correlate with query latency and disk wait. Killing the loudest query sometimes helps; upgrading CPU when you’re IO-bound never does.
Communicating during a load incident
Say: “Load is elevated due to IO wait on volume X; CPUs are idle; we’re shedding batch jobs and engaging storage.” Don’t say: “The server is overloaded” without a class of overload. Precision shortens meetings.
Practice
Lab exercise
If you can install stress-ng or stress in a lab, run a CPU worker and an IO worker in separate experiments. Record load average, idle percent, and iowait for each. The contrast teaches more than a chapter of theory.
FAQ
Is load 1.0 “100% CPU” on a 1-core box?
Roughly means one runnable/waiting thread on average — not a literal utilization meter. Prefer CPU% and iowait alongside load.
Why is load high after a disk failed?
Processes sit in D state waiting on I/O that never completes. Fix or migrate storage; reboots may hang if mounts are unhappy.
Should I alert on load average?
Yes, but with CPU count context and secondary metrics (iowait, latency, saturation). Raw load > N alerts without nproc context create pager fatigue.
Does high load always mean I need a bigger VM?
No. Often you need faster disks, better queries, less chatty logs, or a fixed NFS server.
Where do systemd services fit?
A crashing service in a tight restart loop can contribute to load — check failed unit debugging.
Sources
- uptime(1) manual page
- proc(5) manual page, for
/proc/loadavg