Linux OOM Killer: Why Your Process Died and How to Stop the Next One
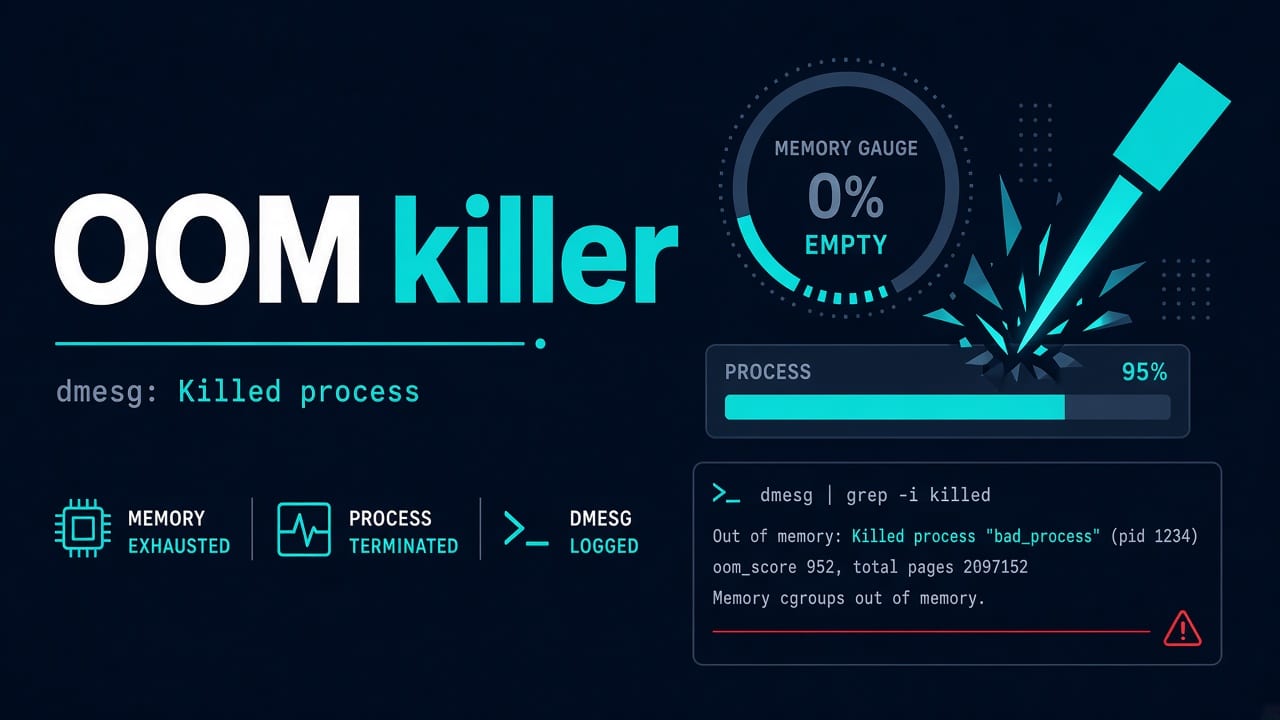
App was running. Then it wasn’t. No tidy stack trace. Just a hole where a PID used to be. On Linux, that quiet murder is often the OOM killer — the kernel deciding RAM+swap pressure is bad enough to sacrifice a process so the box lives.
I don’t romanticize it. OOM killer is a last resort, not a memory manager you should “tune” instead of fixing leaks. Here’s how I prove it happened, who got shot, and what actually changes next week.
Prove it was OOM
sudo dmesg -T | grep -i -E 'oom|killed process' | tail -30
sudo journalctl -k -b | grep -i -E 'oom|killed process' | tail -30
# sometimes:
grep -i oom /var/log/messages
You’ll see lines like Killed process 12345 (node) with a victim and a memory summary. If there’s nothing, maybe someone ran kill -9, or the process exited itself, or you’re on the wrong host. Don’t invent an OOM story without a log line.
What the kernel was thinking (short version)
When reclaim can’t free enough pages, the kernel picks a victim using heuristics (oom_score / oom_score_adj). Big memory hogs score higher. Protected processes can be adjusted. This is not fair, not personal, and not a substitute for capacity planning.
# live scores
ps -eo pid,comm,oom_score,oom_score_adj --sort=-oom_score | head
cat /proc/PID/oom_score
cat /proc/PID/oom_score_adj
First response when production just got shot
- Confirm which PID/name died (journal/dmesg)
- Check if a supervisor restarted it into another OOM loop
free -h,pressures, disk (logs can explode during incidents)- Don’t reboot as step one — you’ll lose evidence and maybe not fix the leak
free -h
cat /proc/pressure/memory 2>/dev/null
uptime
ps aux --sort=-%mem | head
High load with idle CPU often means waiting — disk or reclaim. See high load average on Linux. Disk full makes everything meaner: disk full checklist.
Common real causes
- Memory leak in Node/Java/PHP workers after a deploy
- Workers = CPU count × something huge, times concurrency, times “just raise it”
- One box running DB + app + redis + browsers-in-CI because “it’s only staging” (staging is where habits form)
- Container without limits next to one with limits — host still OOMs
- Backup job that unpacks a tarball the size of the moon into
/tmp
Swap: not a personality test
No swap means OOM arrives faster and harder. Some swap can soften spikes. Endless swap means you thrash and users feel pain before the killer shows up. I add modest swap on small VMs, watch si/so in vmstat, and still fix the leak.


vmstat 1 5
swapon --show
Blindly sysctl vm.swappiness=1 because a blog said so? Measure first. Opinionated defaults without metrics are cosplay.
cgroups, Docker, and “but docker stats looked fine”
If the container hits its cgroup memory limit, you get OOM inside the cgroup — might look like a restart loop in Compose/K8s. Host dmesg still often records it.
docker inspect CONTAINER --format '{{.HostConfig.Memory}}'
docker stats --no-stream
Ops-shaped Compose notes: Docker Compose for ops. Limits are contracts. Without them, one noisy neighbor eats the node.
oom_score_adj: use sparingly
You can protect sshd or a critical agent with a negative adj so the killer prefers the leaky app. That can save your remote session. It can also shoot the wrong thing next. Document every adjustment. Prefer fixing memory over anointing sacred PIDs.
And please don’t lock yourself out while experimenting — SSH hardening still matters when the box is sick.
Application-level fixes that actually stick
- Cap workers / heap (
-Xmx, Node--max-old-space-size, PHPmemory_limit+ FPMpm.max_childrenmath) - Find leaks with profiles, not vibes
- Move heavy jobs off the web tier
- Size the VM for peak, not average Instagram traffic fantasies
MySQL connection stampedes can look like memory death too — see MySQL connection refused when the DB is the one falling over.
Example: the “harmless” report
Suppose a nightly CSV export loads an entire quarter of data into RAM inside one Rails process. It works while the dataset is small. Once the data grows, the OOM killer ends the process, the supervisor restarts Sidekiq, the job is re-enqueued and fails the same way. Cron looks “fine” because the schedule ran, but the work died. A memory cap only contains the damage; the real fix is to stream the export, and alert on OOM kernel messages. The same habits help with cron visibility: cron not running habits apply to “running but useless” jobs.
Going deeper on OOM
Reading the dump, containers and databases.
Monitoring worth having
- Alert on kernel OOM messages (journal/dmesg shipper)
- Alert on available memory and reclaim pressure
- Track container restarts and last exit reasons
- Deploy markers on the same graph as memory
What not to do
- Disable the OOM killer globally because a forum thread was angry
- Reboot on every page and call it stability
- Add 64GB RAM to a leak without a budget conversation
- Run chrome-as-a-service on the same 2GB VM as Postgres
Dangerous cleanup under panic has its own hall of fame: commands that can wipe a server.
Reading the OOM dump without skimming
dmesg OOM blocks list processes with RSS/VSZ-ish numbers and scores. Skimming only the killed name misses that a parent allocator (Java, Postgres, a misconfigured PHP-FPM pool) was the real pig. Read the table once. Paste it into the ticket.
sudo dmesg -T | grep -A40 -i 'Out of memory'
psi / pressure stall information
On modern kernels, /proc/pressure/memory shows some/full stall averages. Rising “full” pressure means tasks are stuck waiting on memory reclaim — users feel slowness before the killer fires.
cat /proc/pressure/memory
# some avg10=… avg60=… avg300=… total=…
# full avg10=…  (full = nobody making progress)
Alert on pressure early. Waiting for OOM is waiting for blood.
Postgres and page cache myths
Linux happy to use RAM for page cache. That’s normal. Free memory near zero with healthy cache is not an emergency by itself. OOM happens when reclaim can’t satisfy anonymous memory demand. Don’t free page cache as a ritual; fix the process eating anon RSS.
cat /proc/meminfo | egrep 'MemAvailable|Cached|SwapTotal|SwapFree|AnonPages'
MemAvailable is the metric I glance at first on modern kernels.
Reproduce safely in a lab
On a disposable VM:
# stress-ng if available — only on machines you can afford to hurt
stress-ng --vm 2 --vm-bytes 90% --timeout 60s
Watch dmesg. Practice reading the kill. Then never run stress-ng on prod because a dare in Slack sounded fun.
Aftercare when the pager quiets
- Graph memory vs deploy markers for a week
- Cap the worst offender
- Add OOM log alert
- Write the runbook line: “if X killed, check Y query / Z worker count”
Nginx might have shown 502 while the upstream kept dying — 502 guide. Services flapping under systemd: journalctl triage. If DNS or weird net delays piled retries and amplified load, also skim DNS not resolving.
FAQ
Is OOM killer a bug?
No. It’s the kernel choosing a victim under memory failure. The bug is usually your capacity or your code.
Why did it kill my process instead of the bigger one?
Scores, adj, namespaces, and timing. Read the OOM dump in dmesg — it lists candidates.
Will more swap stop kills?
It may delay them. If you swap-thrash, users feel the outage before the kill. Fix usage.
systemd says service failed — related?
Often yes: main process killed → unit failed. Dig with journalctl triage and look for OOM lines in the same window.
Where do I practice this calmly?
Linux sysadmin bootcamp and the 2026 roadmap. Trigger OOM in a lab VM on purpose once — better than production as teacher.
Sources
- Linux kernel documentation: the OOM killer
- proc(5) manual page, for
oom_scoreandoom_score_adj