Cloudflare 522 on a Coolify VPS: How I Found the Real Cause
The site loaded, then it didn’t, then it did again. Every few minutes, visitors got “This page isn’t working right now” with a small grey line underneath: HTTP ERROR 522. The Coolify dashboard on the same VPS behaved the same way. This post walks through how I worked out where the fault actually was, because the obvious suspects turned out to be wrong.

What a 522 actually tells you
A 522 means Cloudflare accepted the visitor’s request but could not get a TCP connection to your origin server in time. Cloudflare’s documentation describes two timeouts: it waits about 19 seconds for the origin to answer the initial connection (the SYN+ACK), and about 90 seconds for the origin to acknowledge a request on an established connection. The first number matters later, because the failed requests in my tests took roughly that long.
It also tells you what a 522 is not. Firewall rules, bot protection and AI-crawler controls in Cloudflare act on the visitor’s request at the edge, and they respond with their own pages. A blocked request does not turn into a timeout towards your origin.
| Symptom | Usually means |
|---|---|
| 403, or Cloudflare error 1020 | A WAF or firewall rule blocked the visitor |
| Challenge page (“Verify you are human”) | Bot Fight Mode, a managed challenge or a rate rule |
| 429 | Rate limiting |
| 522 after about 19 seconds | Cloudflare could not connect to the origin |
| 502 / 520 / 521 | The origin answered badly, closed early, or refused the connection |
So a 522 points you at the path between Cloudflare and the server, or at the server itself. A WAF or bot block or challenge does not produce one. (A misconfigured Origin Rule that sends traffic to the wrong host or port can, so check those too.)
My first suspect was wrong
The problem started around the time I began using an automation connector against WordPress, so I assumed the connector was overloading the site. That is a natural guess and I could not have proved it wrong from the outside. What eventually cleared it was measuring the server, not reasoning about it. Before you blame a recent change, get evidence that separates “the server is struggling” from “the network is dropping traffic”.
The test that separates the origin from the path
The single most useful test is to request the same page twice: once through Cloudflare, and once straight to the origin IP, bypassing Cloudflare completely. curl --resolve makes that easy.
# Straight to the origin (replace 203.0.113.10 with your server's IP)
for i in $(seq 1 25); do
  curl -skS -o /dev/null -m 120 \
    --resolve example.com:443:203.0.113.10 \
    -w '%{http_code}:%{time_total} ' \
    "https://example.com/wp-json/wp/v2/posts/1?_fields=id&n=$RANDOM"
  sleep 1
done
--resolve example.com:443:203.0.113.10tells curl to connect to that IP for that hostname, so DNS and Cloudflare are skipped but the correct hostname and certificate are still used.-kskips certificate verification. It is acceptable for this one diagnostic because the goal is only to see whether the origin answers.-m 120gives each attempt up to two minutes, long enough to see Cloudflare’s own 522 arrive (a shorter limit would make curl give up first and hide it).-Stogether with-sstill prints curl’s own errors, so you can tell a client timeout from a 522.-o /dev/null -w '%{http_code}:%{time_total} 'throws the body away and prints the status code and total time per request.- The
?_fields=idkeeps the response tiny. The randomn=$RANDOMparameter is meant to avoid a cached copy when the same loop goes through Cloudflare, but cache keys can ignore query strings on some setups, so confirm in your origin access log that each request really arrived.
Then run the same loop without --resolve, so it goes through Cloudflare. My results:
| Path | Result |
|---|---|
| Straight to origin, 25 requests | 25 of 25 returned 200, about 0.45 seconds each |
| Through Cloudflare, uncached requests | Many 522s at about 20 seconds; the “successes” took 4.8 seconds or more |
The origin answered every direct probe quickly, while the same requests through Cloudflare were slow or failed. The slow “successes” are consistent with Cloudflare retrying after a first connection attempt got no answer, though that is a hypothesis: only the packet capture below and your origin logs can confirm it.
Confirming it at packet level
To see whether Cloudflare’s connection attempts were even arriving, I captured incoming SYN packets on the server while sending uncached requests through Cloudflare from another machine.
sudo tcpdump -nn -l -i eth0 \
  "dst host 203.0.113.10 and (dst port 443 or dst port 80) \
and tcp[tcpflags] & tcp-syn != 0 and tcp[tcpflags] & tcp-ack = 0"-nndisables name and port lookups so output is fast and unambiguous.-i eth0listens on one interface. Check that it is your real public interface (ip -br addr) and, on a VPS behind NAT, that the address in the filter is the one the server actually sees, or an empty capture proves nothing.- The filter keeps only incoming packets to ports 80 and 443 that have the SYN flag set and the ACK flag clear, which is exactly a new connection attempt.
Over 70 seconds and ten requests that each needed the origin, only one new connection attempt from a Cloudflare address arrived. Two caveats: the filter also matches retransmitted SYNs, and Cloudflare reuses connections, so requests and SYNs do not map one to one. Even so, when requests are failing with 522 and almost no SYNs reach the interface, the packets are being lost before the machine sees them. Nothing on the server can answer a packet it never receives, which points away from the web server, the application and the plugins. For firmer proof, capture both directions and correlate with request timestamps and ray IDs.
The cheapest test of all: try a different network
The clue that made everything click did not come from a command. Opening the same site from a different network, for example a phone on mobile data instead of home broadband, made the errors disappear. That is not luck. Cloudflare is anycast, so visitors on different networks are often routed to different Cloudflare data centres, and each data centre reaches your origin over its own path.
If the site fails from one network and works from another, that suggests a network-dependent fault, quite possibly between one Cloudflare data centre and your server (different networks can also reach the same data centre, and features such as tiered caching can separate the data centre you see from the one that talks to your origin, so compare ray IDs and timestamps rather than assuming). You can see which data centre served a request from the three letters at the end of the CF-RAY response header:
curl -sI https://example.com/ | grep -i cf-ray
# cf-ray: 8a1b2c3d4e5f6789-SIN   (SIN = Singapore)
-s silences the progress meter, -I requests only the headers, and grep -i cf-ray picks out the one header that carries the ray ID and data-centre code. Note the code for a failing request and for a working one. Those two codes, plus a few ray IDs, are exactly what your hosting provider or Cloudflare support needs to trace the lost packets. It also explains why a hosts-file entry pointing at your origin IP fixes things for you personally: it skips Cloudflare, and therefore the bad path, for your own machine only. Your visitors still go through it.
What I ruled out on the server
Before concluding “it’s the network”, I checked the host properly. Every item below was clean.
| Check | Command | Result |
|---|---|---|
| Memory pressure or OOM kills | journalctl -k | grep -i oom, free -m |
None; 11 GB free |
| CPU load | uptime, vmstat 1 3 |
Load about 1 on 4 cores |
| Connection tracking full | cat /proc/sys/net/netfilter/nf_conntrack_count |
168 of 262,144 |
| Listen queue drops | nstat -az TcpExtListenDrops TcpExtListenOverflows |
0 and 0 |
| Firewall dropping Cloudflare | iptables -S INPUT (also check iptables -S DOCKER-USER, nft list ruleset and your provider’s firewall panel) |
Policy ACCEPT, no drop rules on the host; the provider’s own filtering cannot be seen from inside the server |
| Containers | docker ps, docker inspect |
All healthy, no restarts, no OOM |
| Disk | df -h / |
9% used |
Check that DNS points where you think it does
One of Cloudflare’s documented causes of 522 is a DNS record that points at the wrong IP. Both hostnames here, the site and the Coolify dashboard, are proxied A records, and both must point at the server’s current public IP.

Compare the record’s content with the address the server actually has. If they differ, you have found your 522. In this case they matched, and direct requests to that same IP worked, so DNS was not the problem.
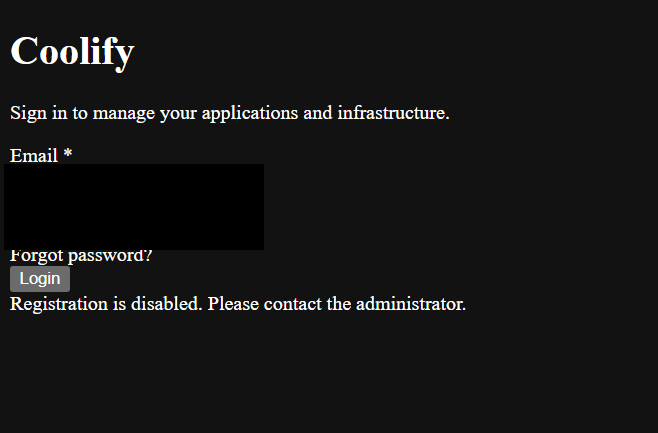
The Coolify login page behaved the same way as the site, which is a useful clue in itself: two unrelated applications failing in the same intermittent pattern suggests a shared layer (the network path, or the host) rather than either application, although one application exhausting shared resources is still possible, which is why the host checks above matter.
Is a Cloudflare bot or AI rule causing this?
It is worth checking, but the evidence says no. Bot Fight Mode, WAF custom rules and AI crawler controls all decide what to do with a visitor’s request. When they block, the visitor gets a 403, a 1020 page or a challenge, and Cloudflare never opens a connection to your origin for that request. A 522 is the opposite situation: Cloudflare tried to open a connection and got no answer.
To confirm in your own account, open Security, then Events, and filter by the time of a failure. Match the failing request by your visitor IP, ray ID and timestamp. If you see “Block” or “Managed Challenge” entries for it, adjust those rules; unrelated blocks of other visitors are normal and need no change. If nothing matches the failing requests, that fits a 522 (security events can be sampled, so absence is a strong hint rather than proof). Also check that no Origin Rule or Page Rule is sending traffic to a different host or port.
A side finding: the server was under SSH attack
While I was on the server I looked at the authentication log, and it was ugly. About 74,700 failed SSH password attempts in the log (a busy day’s worth, from many addresses), with root login and password authentication both enabled and no fail2ban. It was unlikely to be the cause of the 522s, since about one attempt per second on average is light load for a four-core machine, and the CPU and connection checks above were clean, but it is a real risk and worth fixing on any VPS.
grep -c "Failed password" /var/log/auth.log
grep "Failed password" /var/log/auth.log | grep -oE "from [0-9.]+" | sort | uniq -c | sort -rn | head
The first command counts failures. The second pulls out the source addresses, counts each one and lists the worst offenders. To fix it:
# /etc/ssh/sshd_config
PasswordAuthentication no
KbdInteractiveAuthentication no
PermitRootLogin prohibit-password
Confirm your SSH key login works first, check the syntax with sudo sshd -t, and read the effective settings with sudo sshd -T | grep -Ei 'passwordauth|kbdinteractive|permitroot' (other files under sshd_config.d can override the main file).
Then install fail2ban, enable the firewall (on a Coolify server also keep the ports Coolify itself needs open; the SSH hardening checklist covers the details), and reload SSH with sudo systemctl reload ssh. Test a second session before closing the first so you cannot lock yourself out.
Fixes, from most to least effective
- Open a ticket with your hosting provider. Include the direct-versus-Cloudflare results, the packet capture summary, and an
mtrreport from a Cloudflare-adjacent network if you can get one. Ask specifically about packet loss to your IP and any DDoS or firewall filtering on their side. Cloudflare’s own guidance lists blocked or rate-limited Cloudflare IPs at the host as a top cause. - Allow Cloudflare’s published IP ranges in any provider-level or server firewall.
- Use Cloudflare Tunnel. The tunnel connector on your server makes an outbound connection to Cloudflare, so Cloudflare no longer needs to reach port 443 from outside. Because the server dials out, it may avoid the affected inbound route or provider filtering, though it is not a guaranteed fix since the connection still needs a working network path. It is available on the free plan, and Coolify supports it.
- Cache what you can at the edge with a Cache Rule for public blog pages, and consider Always Online, which may show a saved static copy of some pages when the origin is unreachable (it does not keep dynamic features working, and it does not cover every page). Never cache
/wp-admin/, your login page or logged-in traffic.
Checklist for the next 522
- Note the status code and how long the request took. About 19 seconds suggests a connection problem.
- Test through Cloudflare and directly to the origin with
curl --resolve, and try the site from a second network. Note theCF-RAYdata-centre code of failing and working requests. - If the origin is fast and Cloudflare is not, capture inbound SYNs with tcpdump.
- Check memory, load, connection tracking, listen drops and firewall rules on the host.
- Confirm the DNS record matches the server’s real IP.
- Look at Security Events, but do not expect a bot or AI rule to explain a 522.
- Escalate to the host with your evidence.
Keep reading
- Nginx 502 Bad Gateway: What It Really Means and How to Fix It — Another gateway error and how to trace it.
- Linux Networking Basics for Sysadmins: IP, DNS, ss, curl — The network checks behind a connection timeout.
- fail2ban vs Cloud Security Groups: What Actually Stops the Bots — Where cloud security groups and host firewalls fit.
Sources
- Cloudflare: Error 522, connection timed out, for the 19-second timeout and the list of causes.
- Cloudflare IP ranges, for firewall allow-lists.
- Cloudflare Tunnel documentation.
- curl manual, for
--resolve,-wand-m. - tcpdump manual, for the capture filter syntax.
Related: The Coolify dashboard itself can also fail while your sites stay up. See what to check when the Coolify container is unhealthy after an update.