Nginx 502 Bad Gateway: What It Really Means and How to Fix It
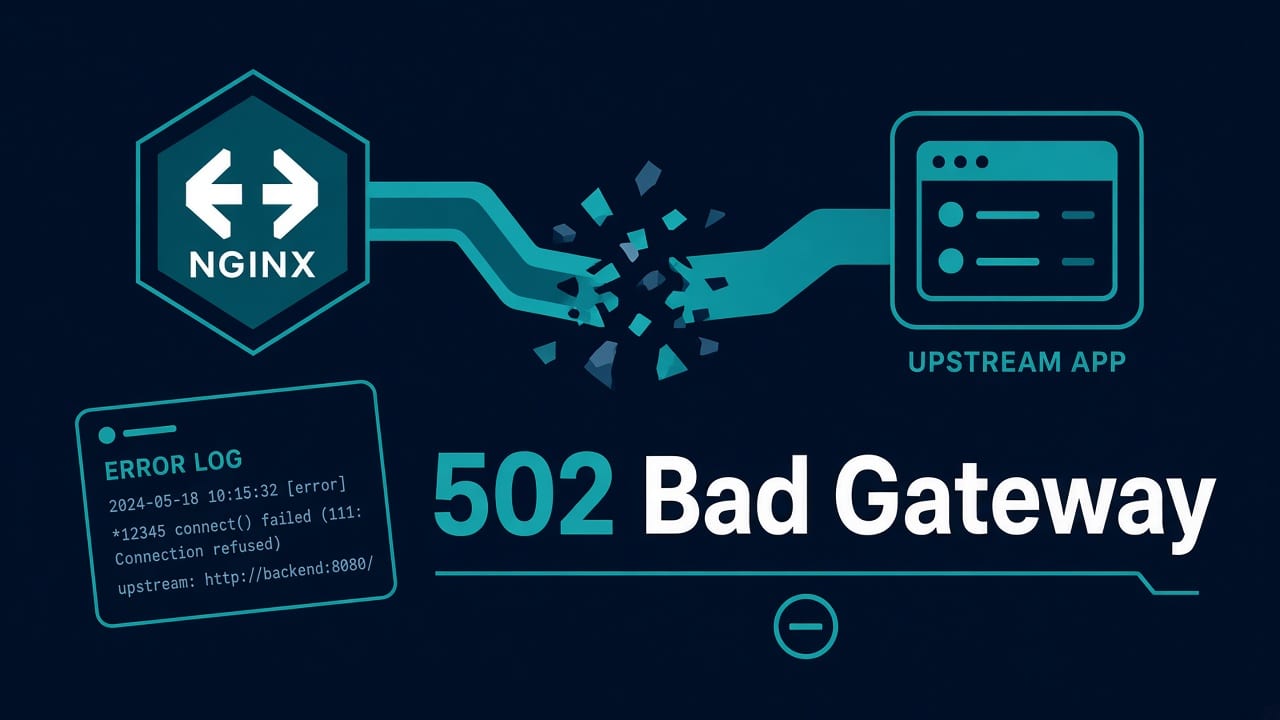
Browser says 502 Bad Gateway. Monitoring lights up. Someone pastes a screenshot into Slack like that helps. Chill — 502 from nginx almost always means the same thing: nginx itself is fine, the thing behind it is not answering the way nginx expects.
I treat 502 as “upstream problem,” not “rewrite the whole vhost.” Grab chai, open two terminals, and work the checklist below. If you’re still building muscle on the CLI, the Linux roadmap for beginners and the sysadmin bootcamp sit nicely next to this.
What 502 actually means (skip the marketing gloss)
Nginx accepted the client request, then failed to get a usable response from an upstream: PHP-FPM, Node, gunicorn, another nginx, a container published port — whatever you put in proxy_pass or fastcgi_pass.
502 is not 503 (overloaded / temporarily unavailable) and not 504 (timeout waiting). People mash those together in tickets. Read the status code before you “fix” the wrong layer.
- 502 — upstream connection failed, reset, or returned garbage nginx won’t accept
- 504 — nginx waited, upstream never finished in time
- 503 — often “no healthy upstream” or deliberate maintenance
First 90 seconds
sudo nginx -t
sudo systemctl status nginx
sudo tail -n 80 /var/log/nginx/error.log
# Debian/Ubuntu often:
# /var/log/nginx/error.log
# RHEL-ish:
# /var/log/nginx/error.log  (same idea)
Error log lines you actually want:
connect() failed (111: Connection refused)— nothing listening on that socket/portconnect() failed (2: No such file or directory)— Unix socket path wrong or FPM downupstream prematurely closed connection— app crashed mid-responseupstream timed out— that’s heading toward 504 territory; still fix upstream, not “more nginx”
If nginx won’t start at all, stop and do the systemd failed-to-start triage first. Different animal.
Match the error log line to the cause
The exact text in /var/log/nginx/error.log usually points to the right branch of the checklist. For a Unix socket, the line reads connect() to unix:/path/to/socket failed (...) instead of connect() failed (...). Treat each row as a likely cause, not proof:
| Error log line | Usually means |
|---|---|
connect() failed (111: Connection refused) |
Nothing is listening on that port or socket. The process is down or bound somewhere else. |
connect() failed (13: Permission denied) |
nginx cannot open the socket: file permissions, a parent directory it cannot traverse, or SELinux. |
connect() failed (2: No such file or directory) |
The socket path in fastcgi_pass or proxy_pass is wrong, or the service never created the socket. |
upstream prematurely closed connection |
Often the app crashed, was killed (check for the OOM killer) or closed the connection early. |
recv() failed (104: Connection reset by peer) |
The backend dropped the connection mid-request, often after a crash or a worker restart. |
upstream sent too big header |
Response headers are larger than the buffers. Look at why the headers are so large before raising proxy_buffer_size or fastcgi_buffer_size. |
no live upstreams |
No server in the upstream group is currently eligible, for example because all are marked failed or disabled. |
A line saying upstream timed out (110: Connection timed out) normally produces a 504 Gateway Timeout rather than a 502, but it points at the same place: a slow, stuck or unreachable backend.
Is the upstream even listening?
Open the site config. Find proxy_pass or fastcgi_pass. Note host, port, or socket.
# TCP upstream example: 127.0.0.1:3000
sudo ss -ltnp | grep ':3000'
curl -sv http://127.0.0.1:3000/health 2>&1 | head

# Unix socket example: /run/php/php8.2-fpm.sock
ls -l /run/php/php*.sock
sudo ss -xlp | grep php
Connection refused on the same box? Your app/unit is down, bound elsewhere, or crashed after start. Port-already-in-use fights belong in Address already in use — I’ve lost an evening to two Node processes claiming the same port while nginx pointed at a ghost.
PHP-FPM special (WordPress shops, raise your hand)
Half the 502 tickets I see in India SMB hosting are “FPM pool died” or “wrong sock path after a PHP upgrade.”
sudo systemctl status php8.2-fpm   # version yours
sudo journalctl -u php8.2-fpm -n 100 --no-pager
# pool config often under /etc/php/8.2/fpm/pool.d/www.conf
grep -E 'listen|user|group' /etc/php/*/fpm/pool.d/*.conf
Match nginx’s fastcgi_pass to FPM’s listen =. Sock owned by www-data while nginx runs as something else? Permissions bite. After a distro upgrade, sock names change (php8.1 → php8.2) and nobody updates the vhost. Classic.
Contact forms “not sending” while the site throws intermittent 502? Different bug — see WordPress contact form not sending — but a dead FPM makes everything look haunted.
Too few PHP-FPM workers
If the PHP-FPM log contains server reached pm.max_children setting (N), consider raising it, the pool has hit its concurrency limit and extra requests wait or fail. Depending on timeouts, that can surface as a 502 or a 504. To size the pool from real numbers, measure the average memory of a worker while the site is under realistic load, then divide the RAM you can give PHP by it:
ps --no-headers -o rss -C php-fpm8.3 | awk '{ s += $1; n++ } END { if (n) printf "%.0f MiB average over %d processes\n", s / n / 1024, n }'
Change the process name to match your PHP version. Treat the result as a starting estimate: RSS counts shared memory more than once, workers grow over time, and an idle pool understates the peak. As an illustration, 2 GiB for PHP at roughly 60 MiB per worker suggests about 30 workers, with headroom left for traffic spikes. Setting pm.max_children higher than the RAM allows only swaps 502s for swapping and OOM kills.
Timeouts and “it works on curl locally”
App responds in 2s for health checks, 45s for the report endpoint. Default proxy_read_timeout is often 60s; some stacks set 10s “for security.” User hits the slow path → 502/504 → you swear the app is fine because you only curl /health.
# inside the location / server block (tune carefully)
proxy_connect_timeout 5s;
proxy_send_timeout 60s;
proxy_read_timeout 60s;
fastcgi_read_timeout 60s;   # for PHP
Don’t crank timeouts to 10 minutes and call it architecture. Fix the slow query. Timeouts are a seatbelt, not a lifestyle.
Containers and compose
Nginx on the host, app in Docker: proxy_pass http://127.0.0.1:8080 only works if you published that port. Nginx in the same compose network should use the service name, not localhost — localhost inside the nginx container is the nginx container.
docker compose ps
docker compose logs app --tail=100
curl -sv http://app:3000/   # from a debug container on the same network
I’ll dig into ops-shaped Compose elsewhere in Docker Compose for ops people. Short version: name the upstream, publish only what you must, watch restart loops.
SELinux and “why does it only fail in prod?”
On RHEL/Rocky with enforcing SELinux, nginx may be blocked from talking to the upstream socket or port. AVC denials look like mysterious 502s. Read them properly — I wrote the rage-quit-free version at SELinux permission denied.
Disk full, OOM, and “upstream closed”
App OOMs → connection reset → 502. Disk full → logging/temp fails → weird crashes → 502. Before you rewrite proxy headers, check:
df -hT
free -h
dmesg -T | tail -50
# OOM killer fingerprints:
sudo journalctl -k | grep -i 'killed process'
Disk triage: df, du, lsof, inodes. Memory death: OOM killer explained. High load without CPU: high load average.
Example: the “deploy fixed nothing” night
Imagine 502 spikes after a “tiny” Node deploy. The nginx error log says connection refused on 127.0.0.1:3000. The new systemd unit sets PORT=3001, so the process is actually bound to 127.0.0.1:3001, while production nginx still proxies to 3000. The CI health check curls port 3001 directly, so it passes and never exercises the nginx path. Three dashboards are green and users are unhappy.
Fix was one digit and a rule: health check URL must be the same string nginx uses. Document the port in the inventory. Boring wins.
Checklist I keep in the runbook
- Confirm it’s really 502 (not 504/503) in response headers
nginx -t+ error.log last lines- Resolve upstream: host/port/socket from config
ss/ sock exists / unit active- curl upstream from the nginx host (or same netns)
- journalctl for the app/FPM unit
- disk, memory, OOM, SELinux if still weird
- only then touch timeouts or buffer sizes
Rarer causes
If upstream, PHP-FPM and timeouts check out, look here.
Buffers, headers, and the rare “real” nginx bugs
Occasionally you need bigger proxy_buffer_size for fat headers, or you botched Host / X-Forwarded-* and the app rejects the request. Those usually leave clearer app logs than a dead socket. Still: dead upstream first, clever headers second.
DNS in proxy_pass http://backend.internal can also bite when resolver caches go stale — if names stop resolving on the box, read DNS not resolving on Linux.
Don’t “fix” 502 by exposing the app port publicly
Temptation: open 3000 to the world so “we can bypass nginx.” That’s how you skip TLS, auth, and rate limits. Fix the proxy path. Keep SSH sane while you work — SSH hardening checklist — and don’t debug production from a random café Wi-Fi without a plan.
Upstream keepalive and flaky apps
Idle keepalive to a crashing app can surface odd 502 patterns. If you see bursts after deploys, check whether the new release crashloops under the first real traffic, not only under health checks. Compose/systemd restart limits matter — Compose for ops, systemd.
Also confirm you’re not load-balancing to a dead peer still listed in an upstream block. One bad server in upstream {} with poor health checks = intermittent 502 roulette.
upstream app {
    server 127.0.0.1:3000 max_fails=3 fail_timeout=30s;
    # server 127.0.0.1:3001 backup;
}
FAQ
Why does curl to the app work but the site 502s?
You’re curling a different host, port, path, or Host header than nginx uses. Curl what nginx curls — same socket/port, from the same machine/network namespace.
Is reloading nginx enough?
Only if you changed nginx config. Upstream down stays down until the app unit is healthy.
502 after SSL renewal?
Usually coincidence or a failed reload mid-renewal. Cert expiry is a different outage shape — see SSL certificate expired fix. Still check error.log; a botched reload can leave an old worker confused briefly.
Can fail2ban cause 502?
It can block clients, not invent upstream failures. If bots hammer login and FPM falls over, you get 502 as a side effect — capacity problem. Worth reading fail2ban vs security groups.
Where should I learn the surrounding skills?
SysAdmin to DevOps 2026 roadmap and the free courses hub. 502 debugging is reverse-proxy literacy; it shows up forever.