REST API Healthchecks for Ops: Timeouts and Monitoring
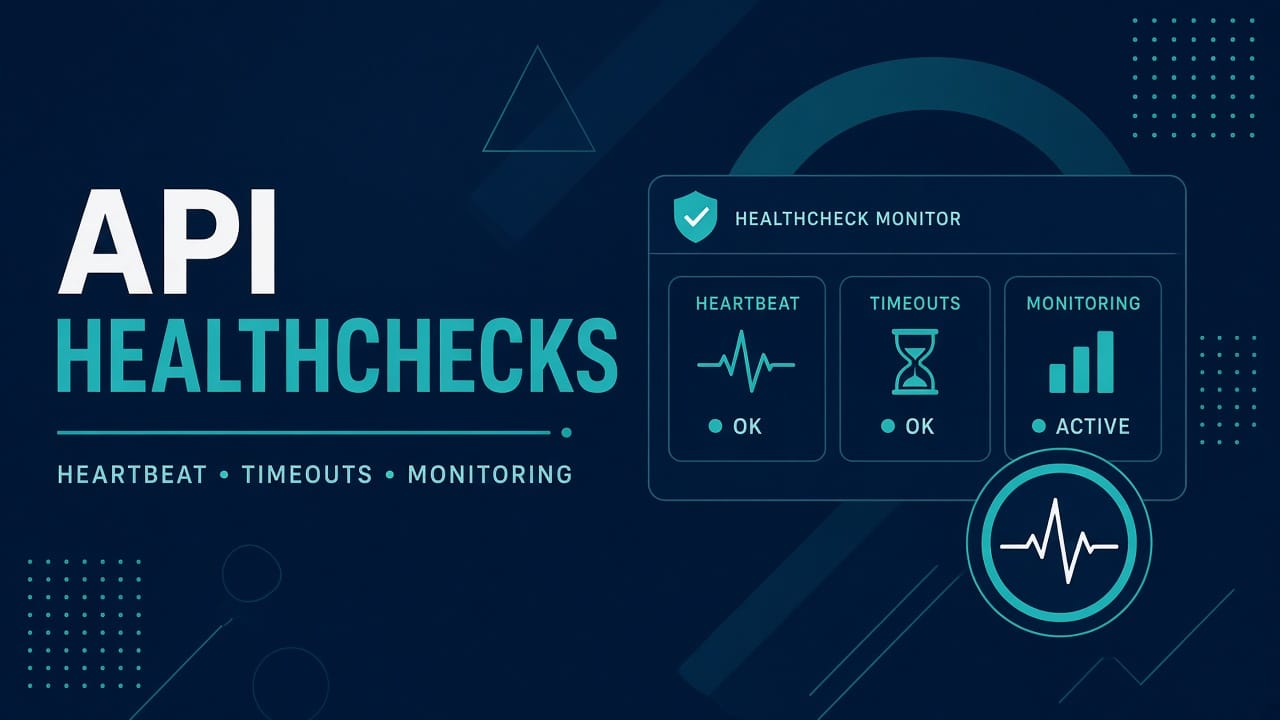
A healthcheck is how automation decides whether your service is alive. Load balancers use it to pick backends, orchestrators use it to restart containers, and monitoring uses it to page you. Get it wrong in either direction and you pay: too weak and traffic goes to a broken instance, too strict and a slow database takes your whole fleet out of rotation.
Below: what the endpoint should return, how to probe it properly with curl, how Kubernetes, load balancers and nginx treat checks differently, and how to alert without paging anyone over one blip.
Liveness, readiness and startup are different questions
People often build one /health endpoint and use it for everything. That is where restart loops come from. There are three separate questions:
- Liveness: is the process stuck beyond recovery? If this fails, restarting is the right response.
- Readiness: can this instance serve traffic right now? If this fails, stop sending requests but do not kill it. A warming cache or a briefly unavailable dependency should not trigger a restart.
- Startup: has a slow-booting application finished starting? Until it passes, the other checks are held off.
In Kubernetes these map to livenessProbe, readinessProbe and startupProbe. A failing liveness probe restarts the container; a failing readiness probe removes the pod from service endpoints without restarting it. Mixing them up is the classic cause of flapping restarts, or of traffic sent to an instance that is not ready.
What a good endpoint returns
Keep the liveness endpoint trivially cheap: return 200 if the process can respond at all. It should not touch the database. Readiness can be deeper, and it is fine for it to return a small JSON body for humans:
HTTP/1.1 200 OK
Content-Type: application/json

{"status":"ok","version":"2026.09.3","checks":{"db":"ok","cache":"ok"}}
Use real HTTP status codes, not a 200 with "status":"error" in the body. Most checkers only look at the status code. Do not return secrets, stack traces or internal hostnames. Health endpoints are often reachable without authentication, so treat the response as public. Do not run migrations, heavy queries or anything with side effects inside a check: it runs every few seconds on every instance.
Testing with curl, flag by flag
curl -fsS --connect-timeout 2 --max-time 5 https://api.example.com/health

curl -sS -o /dev/null -w '%{http_code} %{time_total}\n' https://api.example.com/health-f(--fail) makes curl exit with an error on HTTP status 400 and above. Without it, a 503 page still counts as “success” as far as the exit code goes.-shides the progress meter, and-Sbrings error messages back. Together (-sS) you get clean output that still shows failures.--connect-timeout 2gives up if the connection is not established in 2 seconds, and--max-time 5caps the whole request at 5 seconds. Without these, a hung endpoint hangs your check too.-o /dev/nullthrows the body away, and-w '%{http_code} %{time_total}\n'prints the status code and total time. That second form is useful for spotting slow-but-passing checks.
Timeouts are not optional. A check with no timeout can block for minutes and quietly stops being a check.
Shallow vs deep checks: the dependency trap
A deep readiness check that queries the database is useful on an internal endpoint, but think through what happens when the database has a short outage. If every instance fails readiness at once, the load balancer removes all of them, and a partial degradation becomes a full outage, even for requests that never needed the database.
A workable rule: fail readiness only for dependencies the instance cannot serve requests without, keep optional dependencies (a cache, a metrics sink) out of the pass/fail decision, and report their state in the JSON body for humans. For database connectivity problems themselves, see MySQL connection refused.
Kubernetes probe example
startupProbe:
  httpGet: { path: /healthz, port: 8080 }
  periodSeconds: 5
  failureThreshold: 30
livenessProbe:
  httpGet: { path: /healthz, port: 8080 }
  periodSeconds: 10
  failureThreshold: 3
readinessProbe:
  httpGet: { path: /ready, port: 8080 }
  periodSeconds: 5
  failureThreshold: 2
periodSeconds is the interval between probes; failureThreshold is how many consecutive failures pass before the probe is declared failed. The startup probe here allows up to 150 seconds (30 x 5) for a slow boot, and the liveness probe does not begin until that succeeds, which stops a slow-starting app being killed before it is up. Liveness points at the cheap endpoint and readiness at the deeper one.
Load balancers, nginx and mysterious 502s
When checks fail, load balancers remove targets. AWS Application Load Balancers let you set the interval, the healthy and unhealthy thresholds, the path and the expected status codes per target group. If the health path is wrong, for example it redirects or requires auth, every target looks unhealthy and users see errors even though the app is fine.
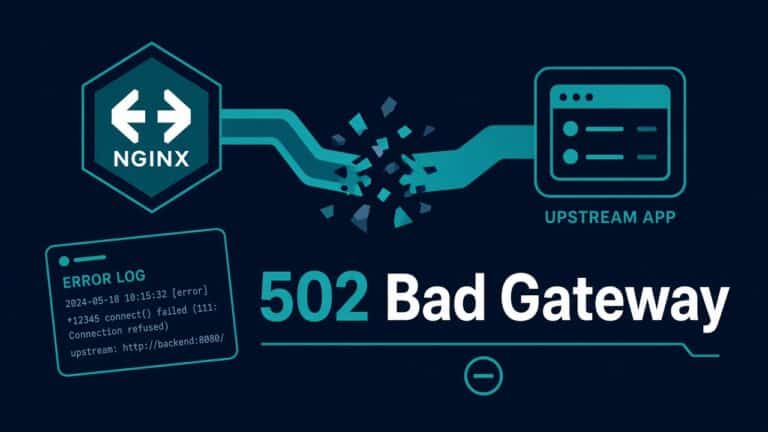
Open source nginx does passive checking only: max_fails and fail_timeout on an upstream server mark it as unavailable after real requests fail. Active health checks with a probe path are an nginx Plus feature. So if you rely on nginx alone, a dead backend is discovered by a user’s failed request. When users report intermittent gateway errors, work through nginx 502 Bad Gateway.
Running checks from cron or systemd
For hosts without an orchestrator, run the curl check on a schedule and alert on failure. Wrap it with the lock, timeout and logging pattern in scheduling and wrapping cron jobs, and use the retry and exit-code conventions from Bash logging and error handling. A systemd timer with a oneshot service works equally well and gives you the result in the journal (see systemd for new admins).
Do not train yourself to ignore TLS errors
It is tempting to add -k to curl so an expired or mismatched certificate does not fail the check. Do not do this in monitoring. A check that ignores certificate errors will happily report green while users see browser warnings. Monitor the certificate and its expiry explicitly instead; the fixes are in SSL certificate expired and DNS not resolving.
Alert design: page on sustained failure
A single failed check is usually noise: a deploy, a garbage-collection pause, a packet dropped. Alert when the check fails several times in a row (for example three consecutive failures, or two minutes of failure), and put useful context in the alert itself: the URL, the status code, the response time, the region or probe location, and a link to the runbook. An alert that says “health check failed” costs the responder five minutes finding out what failed.
Common questions
Should the health endpoint require authentication?
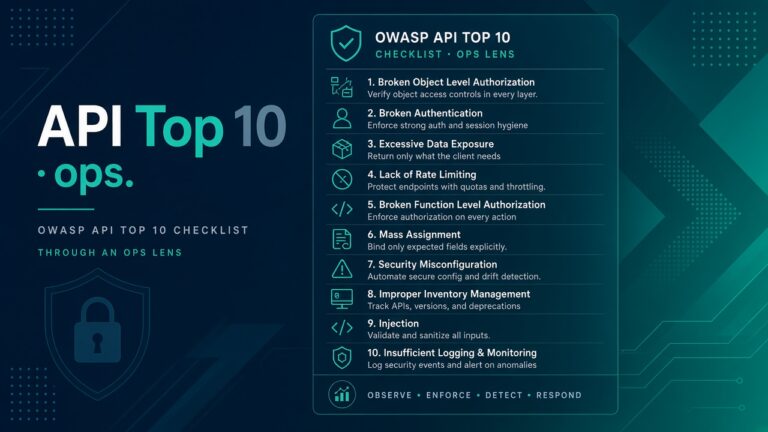
Liveness and readiness endpoints used by a load balancer or orchestrator are usually open but expose almost nothing. Put detailed diagnostics on a separate, authenticated internal endpoint. For the wider picture, see API security basics for sysadmins.
How often should I check?
Every 5 to 10 seconds is common for orchestrator probes. For external uptime monitoring, 30 to 60 seconds is typical. Faster checks find failures sooner but add load and noise.
Should a failing dependency fail readiness?
Only if the instance genuinely cannot serve without it. Otherwise report the state in the body and let real traffic decide.
Sources
- Kubernetes: configure liveness, readiness and startup probes
- curl manual, for
-f,-sS,-wand timeout options - AWS: health checks for Application Load Balancer target groups
- nginx upstream module, for
max_failsandfail_timeout